
getting started
You have your brand new datum sensor plugged in, blue lights are on and flashing but not sure what to do next? Here’s a quick introduction to some of the capabilities and how to get started right away.
There are a number of great tutorials out there on how to use the serial interface that’s at the heart of how you interact with the datum sensors. Sparkfun and Adafruit in particular have some great guides available. For this example we’ll be using the Serial Monitor built into the Arduino IDE. It’s not as full featured as some of the other options out there but it is readily available on Windows, Linux, and macOS.
identify the port
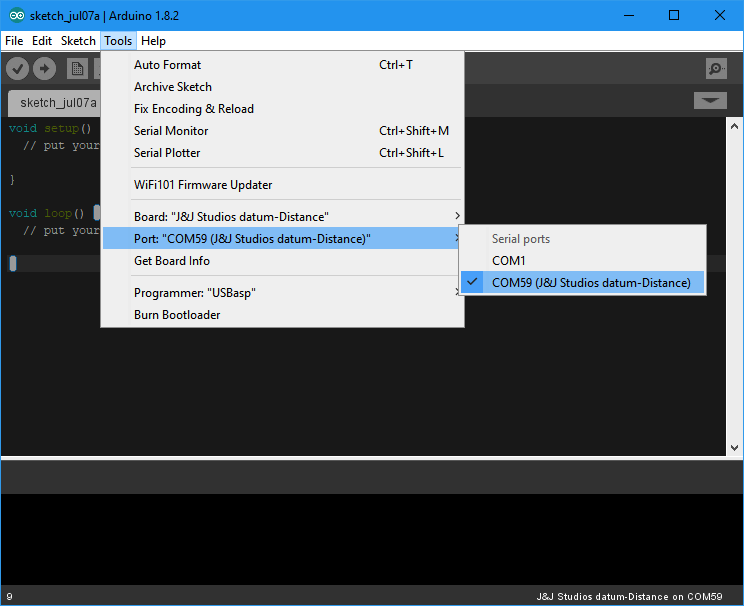
In the Arduino IDE identifying the port is very straightforward. Click Tools on the main menu followed by Port. In the drop down menu select the port corresponding to the board you have plugged in.
open a serial terminal
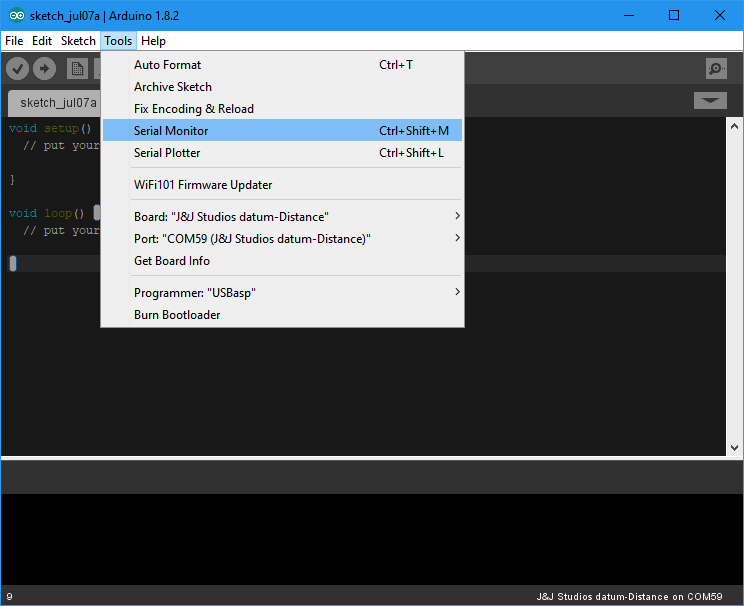
Opening a serial termianl in the Arduino IDE is also very straightforward. Click Tools again and then click on ‘Serial Monitor’.
connect to the port
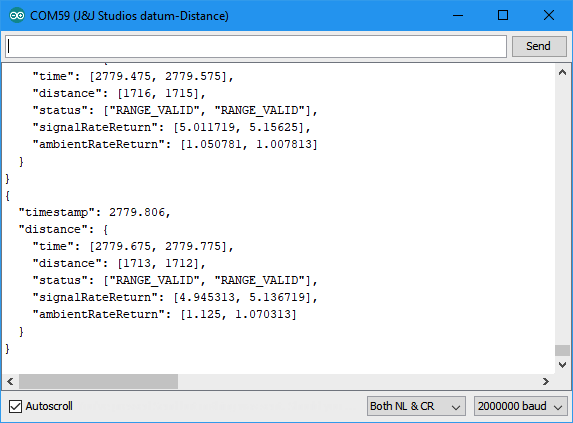
This new window is the connection to the serial interface on the datum boards. The live data from the sensor is being streamed into this window.
basic commands
One of the great features about the Serial Monitor is that the send and receive windows are separate from each other. This makes entering commands much easier when automatic reporting is enabled. To make exploring the capabilities of the datum sensors easier let’s disable the automatic reporting. Cut and paste the command below into the window as shown and then click Send.
set /config?automaticReporting=false
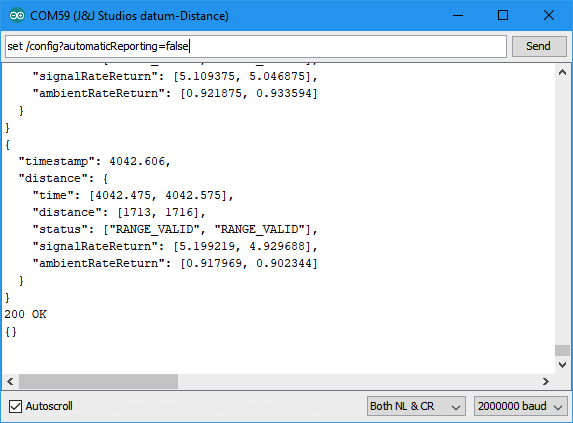
The sensor responds with 200 OK indicating the command was sent successfully. If the command isn’t recognized the sensor will respond with 400 BAD REQUEST.
To see all the information about the root device and individual sensors copy the command below into the window and click Send again.
get /
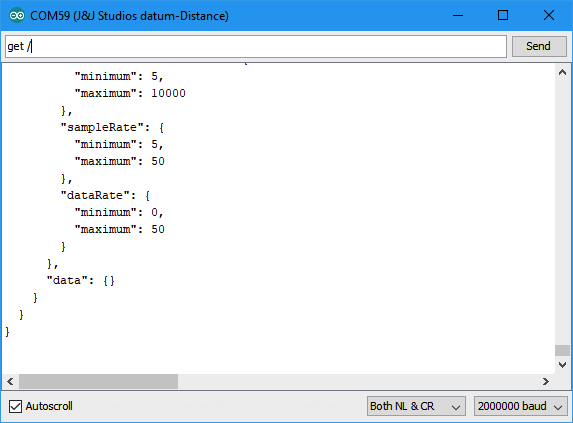
Click here to see the full response.
{
  "device": {
    "manufacturer": "J&J Studios LLC",
    "product": "datum-Distance",
    "hardwareVersion": 1,
    "firmwareVersion": 1,
    "protocolVersion": 1,
    "UUID": "00-04-A3-0B-00-12-1B-7C"
  },
  "config": {
    "friendlyName": "friendlyName",
    "reportRate": 5,
    "automaticReporting": false,
    "compactReport": false
  },
  "options": {
    "friendlyName": {
      "minimum length": 0,
      "maximum length": 32
    },
    "reportRate": {
      "minimum": 0,
      "maximum": 50
    },
    "automaticReporting": ["true", "false"],
    "compactReport": ["true", "false"]
  },
  "sensors": {
    "distance": {
      "device": {
        "manufacturer": "ST Microelectronics",
        "model": "VL53L1X",
        "category": "environment",
        "type": "distance",
        "opticalCenterX": 8,
        "opticalCenterY": 7
      },
      "config": {
        "enabled": true,
        "showStatusInfo": true,
        "showRateReturnInfo": true,
        "units": "mm",
        "filterType": "mean",
        "distanceMode": "medium",
        "timingBudget": 35,
        "interMeasurementPeriod": 40,
        "sampleRate": 20,
        "dataRate": 10
      },
      "options": {
        "enabled": ["true", "false"],
        "showStatusInfo": ["true", "false"],
        "showRateReturnInfo": ["true", "false"],
        "units": ["m", "cm", "mm", "feet", "inches"],
        "filterType": ["none", "min", "max", "mean", "RMS", "median"],
        "distanceMode": ["short", "medium", "long"],
        "timingBudget": {
          "minimum": 20,
          "maximum": 10000
        },
        "interMeasurementPeriod": {
          "minimum": 5,
          "maximum": 10000
        },
        "sampleRate": {
          "minimum": 5,
          "maximum": 50
        },
        "dataRate": {
          "minimum": 0,
          "maximum": 50
        }
      },
      "data": {}
    }
  }
}
The report that was generated contains all the device, config, and options information on the root device and on each of the sensors hosted on the board. If you just want the config information for the root device enter the command below.
get /config
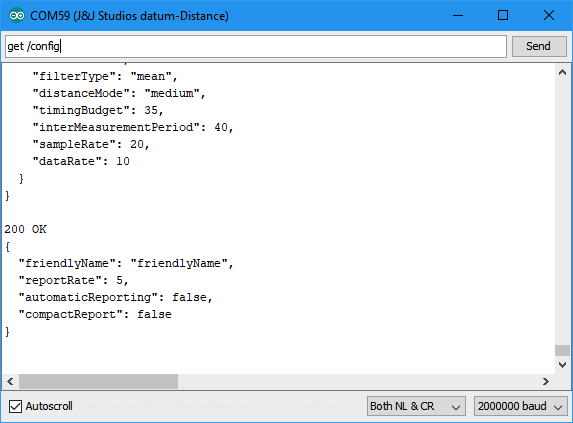
Click here to see the full response.
{
  "friendlyName": "friendlyName",
  "reportRate": 5,
  "automaticReporting": false,
  "compactReport": false
}
Let’s customize the report and reenable the automatic reporting. Enter each of the commands and click Send after each one.
set /config?compactReport=true
set /config?reportRate=10
set /config?automaticReporting=true
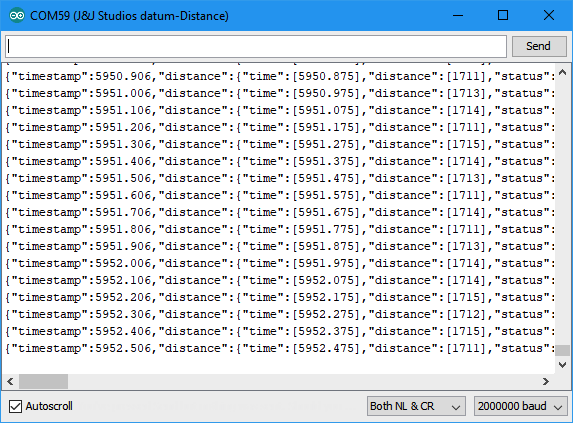
The live data is being streamed again but it’s coming in twice as fast and each report is on a single line. The single line reports are a great format to use when the sensors are communicating with your own programs.
going further
For more information about how the sensors collect, store, and report the information about the world around them check out this page. You can also get more information about each of the sensors on their product pages.